Malbec Labs Network Observability Dashboard Overview
Public observability for distributed systems. Or, inspecting the physical reality behind IBRL.
While monitoring the network over the holidays, one of our engineers married their need for real-time data with the vibe-coding edge of back end development, creating a robust way to look into the heart of the @doublezero network.
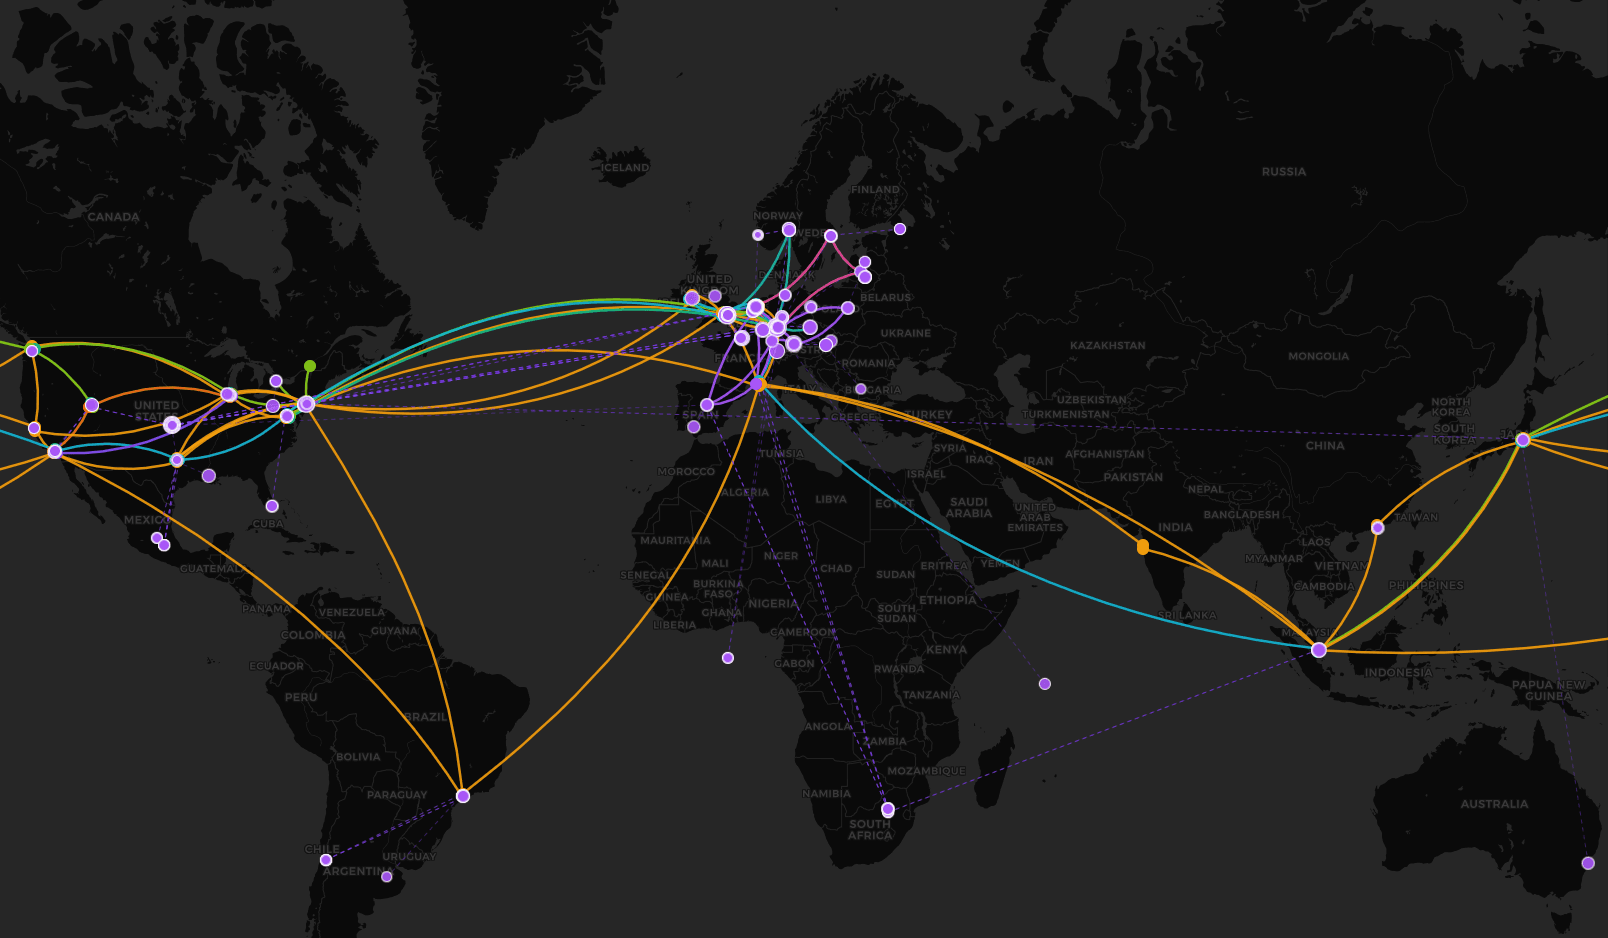
This data explorer, data.malbeclabs.com, is a public, engineering‑grade observability surface for the DoubleZero network. It exposes live data about the network’s physical footprint, contributions, and interconnections, without abstraction layers that obscure reality or remain walled behind operator privileges.
In the world of networking, especially multi‑operator and competitive environments, topology and interconnect data is often private, contractual, or fragmented across organizations. This dashboard foregrounds DoubleZero’s commitment to transparency with public information, continuously updated, and explorable by anyone.
This article describes what the dashboard reports on, why that level of insight matters from an engineering perspective, and how the system works at a high level.
TOOLS
Each tool defines how the network data can be inspected. Together, they provide complementary ways to explore, diagnose, and analyze a live, multi-party network.
Explore: A public, visual entry point for inspecting the live structure of the network, making physical topology and interconnections observable without privileged access.
Status: A real-time view of network health that exposes what infrastructure is operational, degraded, or offline, enabling shared situational awareness across independent operators.
Timeline: A historical record of network evolution that makes infrastructure changes, expansions, and removals visible over time, supporting accountability and post-hoc analysis.
Chat: A conversational interface for interrogating network data that lowers the barrier to understanding complex infrastructure.
Query: A deterministic interface for directly querying the network’s data model, enabling reproducible analysis and independent verification of network claims.
Topology: A graph-level view of how devices and contributors are interconnected, making path diversity, redundancy, and potential latency characteristics explicit.
Outages: A transparent log of network disruptions that grounds reliability discussions in observable events rather than narrative explanations.
Performance: A view into measurable network characteristics, such as latency where available, connecting physical interconnection choices to IBRL-relevant outcomes.
Search: A direct lookup tool for locating specific infrastructure, contributors, or protocol components within the broader network graph.
DOUBLEZERO DATA DOMAINS
These tabs expose the core entities that make up the DoubleZero network. Each represents a different layer of the physical and operational system.
Devices: The individual pieces of physical or logical infrastructure participating in the network. Devices are the smallest unit of analysis for understanding capacity, placement, and failure.
Links: The connections between devices and contributors. Links define how traffic can move through the network and where redundancy or single points of dependency exist.
Metros: Geographic groupings of infrastructure by city or metro area. Metros provide a practical way to reason about latency, regional concentration, and correlated failure domains.
Contributors: Independent operators providing bandwidth and infrastructure surfaced transparently to make decentralization, participation, and responsibility observable.
Users: Entities consuming or interacting with the network. User-level views help contextualize how infrastructure is actually being used.
SOLANA DATA DOMAINS
These tabs connect transport infrastructure to protocol-level behavior on Solana.
Validators: Solana validator nodes connected to or interacting with DoubleZero infrastructure. This view links network topology to validator performance and behavior.
Gossip Nodes: Nodes participating in Solana’s gossip protocol. Observability here provides insight into message propagation, liveness, and latency sensitive protocol dynamics.
This dashboard provides immediate transparency benefits for operators and users of the DoubleZero network. By exposing live topology, interconnections, and history, observability becomes a system property rather than an internal privilege.
As distributed systems grow more complex and as bandwidth-intensive, latency-sensitive workloads like AI become foundational. Performance can no longer be reasoned about abstractly, but must be understood in terms of physical placement, interconnection, and real-world constraints.
Or, IBRL is not achieved through intent alone; but emerges from measurable infrastructure.
AI-generated responses may be incorrect. Do not share sensitive information. See Terms of Use.